
Email marketing is one of the most effective channels for reaching and engaging your audience, but only if your emails actually land in their inboxes. This is where the Email Deliverability Report in the Force24 platform helps.
Understanding your deliverability metrics helps you identify issues, improve performance and maximise the reach of your campaigns. Here's a breakdown of what the report tells you and how to use it to improve your email success.
What do the key metrics in the report mean?
1. Unique Opens
A high open rate suggests your subject lines are compelling and that your emails are landing in inboxes and not spam folders.
Action: Optimise subject lines, preview text and sender names to increase engagement. Also, make sure you're targeting engaged users.
2. Unique Clicks
This metric shows how many recipients interacted with your email content. A low CTR may indicate that your content isn't resonating.
Action: Use strong CTAs, personalisation and mobile-friendly designs to encourage engagement.
3. Bounce Rate
Emails that fail to reach their destination fall into two categories:
- Hard bounces: permanent failures due to invalid email addresses.
- Soft bounces: temporary issues, such as full inboxes or server downtime.
Action: Remove hard bounces from your list immediately and monitor soft bounces for patterns.
Separate percentages are given for both Hard Bounces and Spam Bounces in the top section of the Deliverability Report:

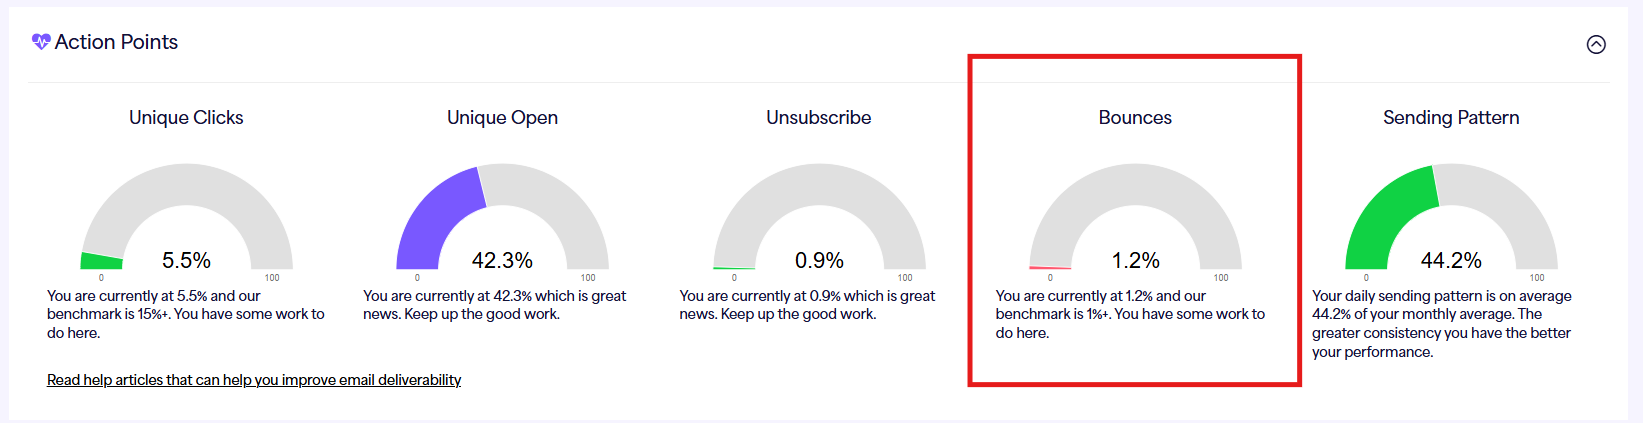
Whereas in the Action Points section, Bounces refers only to Spam Bounces:
Want to know more about bounces?
To learn how to identify and suppress contacts who keep soft or spam bouncing, see our Managing Soft and Spam Bounces in Email Communications article.
4. Sending Pattern
This shows engaged contacts who are regularly receiving communications. It works out who is engaged by looking at the rate of emails sent to contacts with a lead score greater than 0, out of the total emails sent.
For example: if 1000 emails are sent in total, with 700 to contacts with a lead score greater than 0 and 300 to contacts with no lead score, the sending pattern percentage would be 70%.
Action: Make sure you are sending to engaged contacts regularly. Check out our How to create tiered engagement Segments article.
5. Unsubscribe Rate
Some churn is natural, but a rising unsubscribe rate signals that your content or frequency may not be aligned with audience expectations.
Action: Review segmentation and content strategies to make sure they stay relevant.
How do I use the report for ongoing success?
- Segment your data: identify and prioritise engaged users while reducing sends to inactive contacts.
- Monitor trends: track performance over time to spot patterns and adjust accordingly.
- A/B test: experiment with subject lines, send times and content formats to find what works best.
- Improve your sending reputation: maintain consistent sending volumes and follow best practices to build trust with ISPs.
By using your Email Deliverability Report, you can fine-tune your email campaigns, boost engagement and make sure your messages reach the right inboxes at the right time.
Need expert support?
Force24's deliverability experts are on hand to provide tailored insights and recommendations. If you'd like a deep dive into your report or need help improving your email strategy, get in touch through the live chat in the bottom right corner of your Force24 platform, or log a support ticket.